Understanding Entity Relationship Diagrams: A Guide to Data Modeling
Learn what an entity relationship diagram is, how it works in database modeling, and why it’s essential for designing efficient data systems.
What Is an Entity Relationship Diagram? Learn the Basics of Data Modeling and Database Relationships
Introduction to Entity Relationship Diagrams
An entity relationship diagram (ERD) is a visual representation of data and how different pieces of data relate to each other within a system. Used primarily in database design, ER diagrams help developers and database architects structure data logically and efficiently. They are crucial in mapping out the relationships between entities in a relational database and ensuring that the database reflects real-world requirements.
What is an Entity in an ER Diagram?
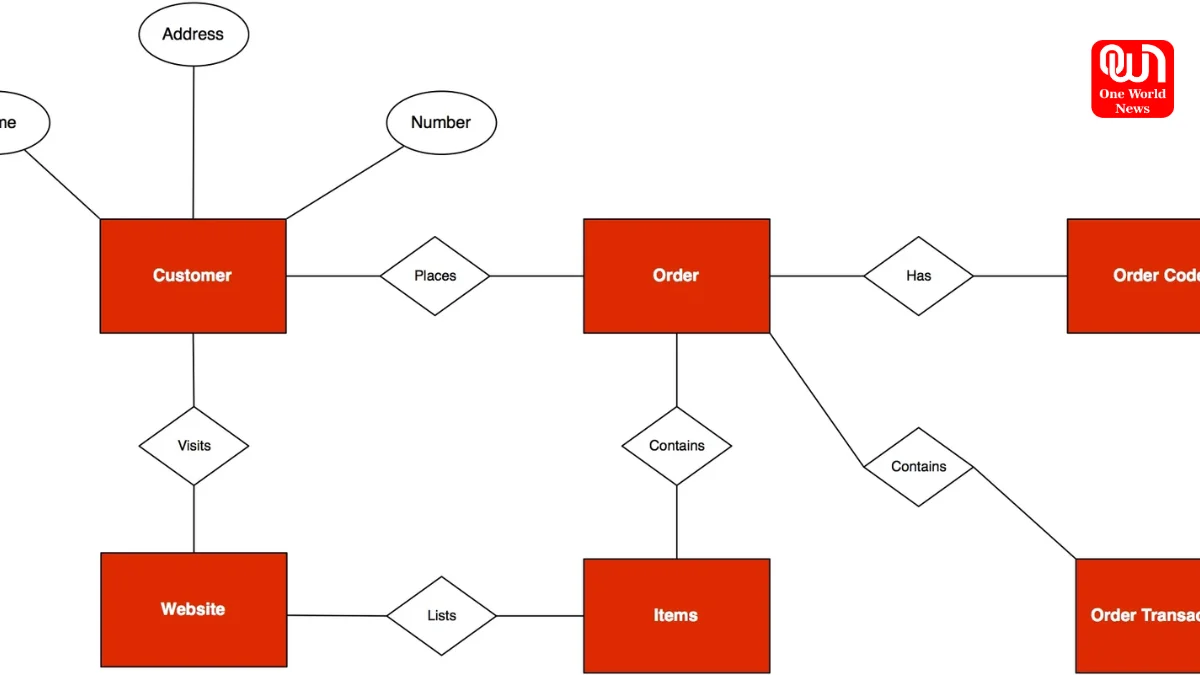
An entity in an entity relationship diagram represents any object, concept, person, or place that has data stored about it in the database. For example, in a university database, “Student,” “Professor,” and “Course” are all considered entities. Entities are usually drawn as rectangles in the diagram and are labeled with singular nouns.
Entities can be classified into two types:
Strong entities: These exist independently and have a primary key.
Weak entities: These depend on another entity to exist and usually don’t have a primary key on their own.
Rread more: Celebrating Blogger Day: Honoring the Voices That Shape the Digital World
Understanding Relationships in ER Diagrams
A relationship defines how two entities are connected in an entity relationship diagram. These relationships help determine how data is associated across tables in a database. For instance, a “Student” may enroll in a “Course,” or a “Professor” may teach a “Course.” These relationships are represented by diamonds in the diagram and are typically labeled with verbs.
Relationships can be:
One-to-One (1:1): A single entity is related to one other entity.
One-to-Many (1:N): A single entity is related to multiple entities.
Many-to-Many (M:N): Multiple entities relate to multiple other entities.
Attributes in an Entity Relationship Diagram
Attributes are the data we store about each entity. For instance, for a “Student” entity, attributes could include Name, Student_ID, Email, and Age. In ER diagrams, attributes are represented by ovals connected to their respective entities.
There are different types of attributes:
Simple attributes: Cannot be divided further (e.g., Age).
Composite attributes: Can be divided into smaller parts (e.g., Full Name into First Name and Last Name).
Derived attributes: Can be calculated from other attributes (e.g., Age from Date of Birth).
Keys and Identifiers
Keys are special types of attributes that uniquely identify an entity in a database. In an entity relationship diagram:
Primary key is an attribute (or a combination) that uniquely identifies each instance of the entity.
Foreign key is an attribute that creates a link between two entities based on the primary key of another.
These keys help maintain data integrity and are essential for forming relationships between different entities in a database.
Why Use Entity Relationship Diagrams?
Using an entity relationship diagram simplifies the process of creating and managing databases. Here’s why they are important:
Clarity: They provide a clear structure for the database, reducing confusion.
Planning: They help in planning the logical structure before actual database creation.
Communication: Developers, designers, and stakeholders can use ERDs to understand how data flows.
Problem Detection: ERDs highlight flaws or redundancies in the data model early in the development cycle.
Read more: Celebrate Love and Companionship This National Girlfriend Day
Conclusion
An entity relationship diagram is a powerful tool in database modeling. By visualizing entities, their attributes, and relationships, ERDs provide a structured and organized approach to designing relational databases. Whether you’re building a small business system or a complex enterprise application, understanding and using ER diagrams can significantly improve data accuracy, integrity, and design efficiency.
We’re now on WhatsApp. Click to join.
Like this post?
Register at One World News to never miss out on videos, celeb interviews, and best reads.